
Series: UX Beyond the Screen — Audience Experience in Live Events (Part 3 of 4)
Digital products won the experience argument partly because they could prove it: funnels, session replays, A/B tests, NPS at scale. Live events never had that instrumentation. A festival’s "analytics" were ticket sales, a post-event survey with a 4% response rate, and the promoter’s gut.
That is changing fast. This post surveys how audience experience in performing arts, festivals and sports is measured today, and what AI methods are adding — with the caveats a responsible practitioner should attach.
The traditional measurement stack
Academic event research measures experience mostly through self-report instruments: festivalscape scales, satisfaction and loyalty constructs, analyzed with structural equation modeling under the Stimulus–Organism–Response framework. These studies are valuable for theory — they tell us, for example, that program content, ambient conditions and visual/symbolic design are the strongest drivers of satisfaction, while crowding sometimes matters less than we assume. But they are slow, retrospective, and sample-limited. In product terms: quarterly surveys, no telemetry.
The AI measurement stack
1. Computer vision crowd analytics. AI models on existing CCTV feeds now monitor crowd density and flow across venue zones, predicting bottlenecks before they form so operators can reroute fans, open gates, or shift concession staffing in real time — with vendors reporting reductions of 30–50% in peak congestion incidents and 20–35% in entry wait times. Startups like WaitTime apply the same techniques to concession queues, publishing live wait times to fans. This is, quite literally, funnel analytics for physical space: drop-off points, time-on-step, rage-quits — except the rage-quit is a fan leaving the beer line.
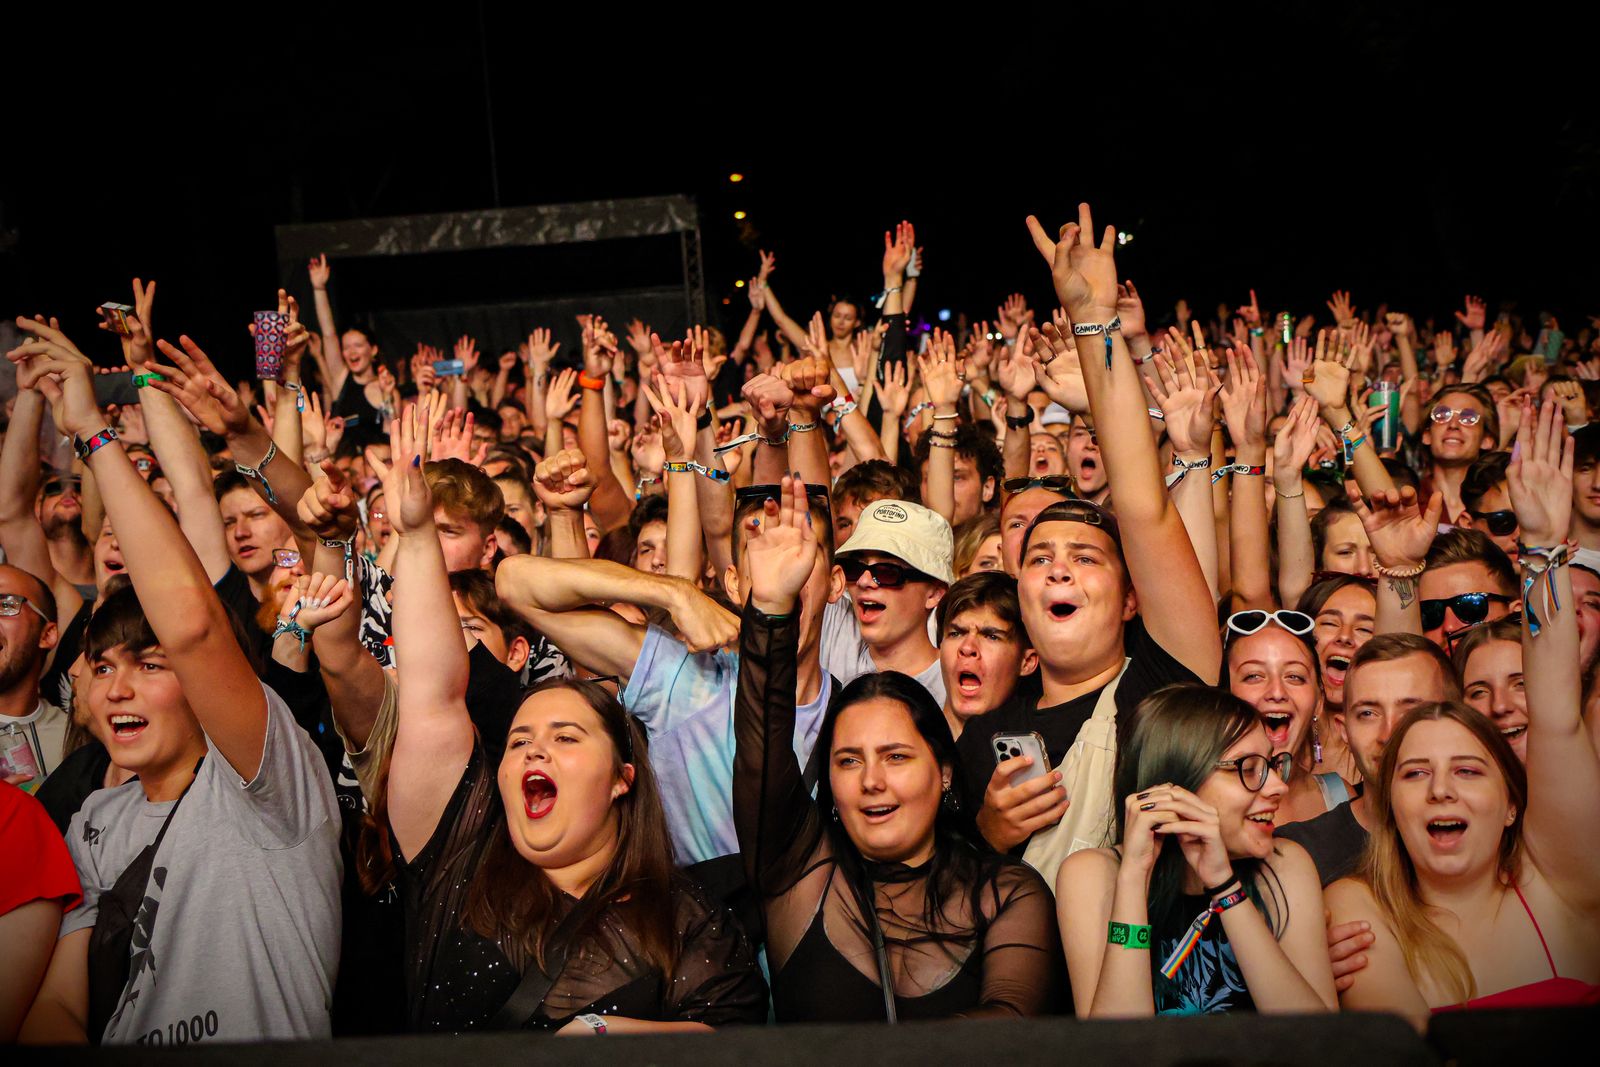
2. Emotion and sentiment detection. Computer vision trained on annotated crowd footage can classify emotions such as joy, frustration, boredom and aggression, and when fused with contextual signals — scoreboard data, in-game events, audio (cheers vs. boos) — it produces moment-to-moment sentiment curves for an audience of tens of thousands. Applications already discussed in the industry include dynamic highlight reels cut from the moments that produced the strongest crowd joy, and sponsorship metrics based on measured emotional peaks.
3. Real-time feedback and predictive operations. Beyond cameras, venues deploy instant physical/digital feedback devices and AI that flags the specific gates or sections where frustration is rising before it spreads, enabling proactive staffing. Social media sentiment analysis adds an out-of-venue signal, catching issues while the event is still running rather than in Monday’s press coverage.
4. The connected venue. IoT integration ties it together — smart parking, automated entry, environmental systems adjusting lighting, temperature and audio — while historical flow data feeds pre-event planning that measurably improves experience scores over successive events. That last point matters most to me: it closes the iteration loop. Design, measure, redesign — the core UX cycle — becomes possible for physical events.
What this enables that surveys never could
Map the AI stack onto a journey and you get, for the first time, continuous experience measurement: arrival flow (vision analytics), in-event emotion (sentiment curves), service friction (queue detection), advocacy (social sentiment), and longitudinal improvement (historical modeling). A UX researcher would recognize this immediately as mixed-methods telemetry — behavioral data that finally lets the qualitative craft of experience design be tested against reality at scale.
It also changes when design happens. Traditional festivalscape research improves next year’s event. Real-time AI improves this one, mid-show. That shifts experience design from an annual planning exercise to an operational discipline — closer to site reliability engineering than to marketing.
The caveats I would put in bold
I build AI products for a living, so let me be equally clear about the risks.
- Emotion recognition is scientifically contested. Facial-expression-to-emotion mapping is noisy, culturally variable, and easy to oversell. Treat sentiment curves as directional signals, not ground truth.
- Privacy and consent. Crowd analytics can be done on anonymized density and flow; individual-level facial analysis is a different ethical category entirely, and researchers in this space explicitly flag privacy, algorithmic bias and the evolving regulatory landscape as open problems. The EU AI Act’s restrictions on emotion recognition and biometric categorization are a preview of where regulation is heading.
- Metric capture. The moment "crowd joy" becomes a sponsorship KPI, someone will design for the metric instead of the audience. We have seen this movie in engagement-optimized feeds.
- Measurement is not design. A dashboard showing frustration at Gate C does not tell you how to redesign Gate C. Interpretation still requires a human with design judgment — which is exactly the argument of my final post.
In Part 4: now that live events have owners with partial mandates (Part 2) and measurement that finally works (this post), does the industry need a UX architect — and what would that role actually do?
References: AI crowd-management and stadium-safety literature (2025); computer-vision crowd sentiment analysis research; real-time feedback/predictive AI in venues; smart-stadium IoT case reports; festivalscape S-O-R measurement studies (Lee et al., 2008; Chen et al., 2019); servicescape prioritization via PLS-SEM/IPMA (2025).